 931.905.0050


The great rotation
January 17, 2017
By now, you have likely heard something, either directly or indirectly, about “The Great Rotation” from bonds into stocks. Just “googling” the term will pull up a whole host of articles written by practically every major financial news organization in existence, and it seems that every “bond king” and market strategist has weighed in with his or her own respective opinions on the matter. In short, the line of thinking behind the rotation is that, after 30+ years of interest rates in the United States generally falling and bond prices, resultantly, rising, an inflection point has been reached or is approaching where now interest rates will rise over time and bond prices will suffer. Most people, at least, seem to agree on that point to some extent, though what exactly that will mean for bonds and stocks as investments remains widely contested. Some have argued that this dynamic will prompt massive money flows to move from bonds into the stock market (producing the titular “great rotation”), while others contend it will not have as big of an effect on aggregate portfolio allocations as expected.
The financial media has tried quite hard to pitch this as a battle between Bill Gross, the well-known portfolio manager at Janus, and Jeff Gundlach, founder of DoubleLine Capital, who have shared a contentious past and don’t mind taking jabs at each other. However, to me, they seem to be saying the same thing except for a slight difference of opinion on the “key level” in the bond market. Gross has come out and said that 2.6% on the 10-Year U.S. Treasury is the line in the sand for the end of the bond bull market, while Gundlach argues that “second-tier managers” can focus on 2.6%, but 3% is the level to watch to “define the end of the bone bull market from a classic chart perspective.” In other words, both of these very smart bond guys, despite their minor differences, believe we are getting close to hitting that inflection point, with Gundlach going on to say that it is “almost for sure” that the 10-Year is going to take out 3% this year.
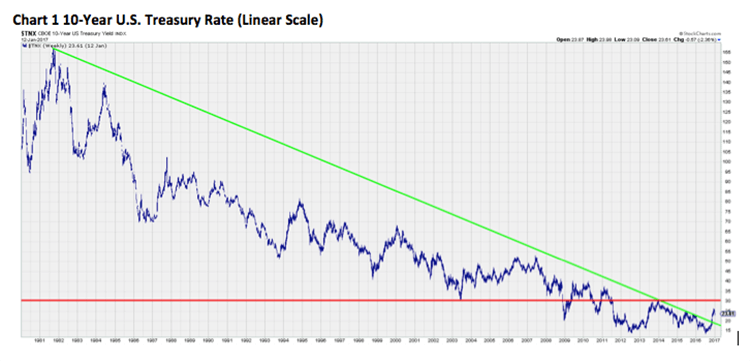
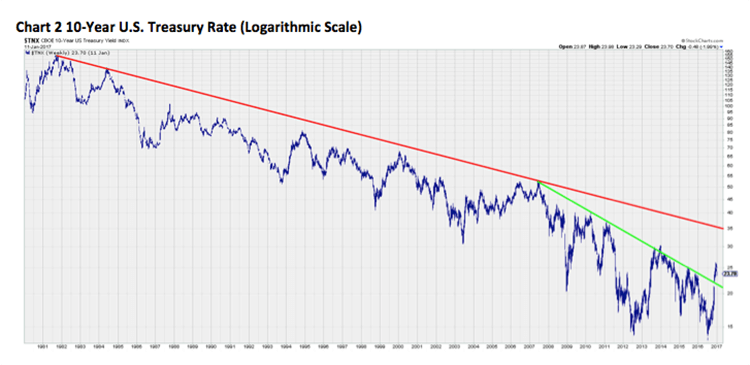
Meanwhile, we have already said that it is very likely that last July marked THE bottom for rates, when the 10-Year U.S. Treasury made an undercut low below the 2012 nadir before quickly recovering to shoot up about 125 basis points (almost a 100% move in percentage terms) by the end of 2016. The future trajectory for rates, therefore, does appear to be upward, but the exact path remains an unknown. Just as yields didn’t go straight down over the last three decades, they will not go straight up in the years ahead, as the last few weeks have reminded us with the 10-Year falling about 10%. Also, while the long-term chart of the 10-Year going back to the early 1980s looks to have already broken its downtrend line when using a linear scale (Chart 1), the logarithmic chart (Chart 2) still has some work to do and would need to better 3.5% before the downtrend is broken. 2.6%, 3%, and 3.5% may all act as fairly strong resistance, too, so it would not surprise me to see interest rates remain range-bound for much of 2017 until expectations about economic growth and inflation pick up enough to power rates above this resistance block. 3%, especially, may be tough to overcome in the next few months until we see just what the new administration’s policies are going to be.
So, what does this all mean for the stock market? Well, market strategists are sort of torn on that point, as well. Jeffrey Kleintop, chief global strategist at Charles Schwab, believes the fund flow shift from bonds to stocks that has taken place over the last two months, which has added $3 trillion to global equity values while bond values have dropped by $2 trillion per Bloomberg, “marks an important juncture” and has “years left to run.” Conversely, David Kostin of Goldman Sachs argued last week in a note that, many institutional investors, the ones who really move markets, are restricted from moving money out of bonds and/or owning stocks, so the impact of the “great rotation” may already be approaching its upper limit since allocations to debt securities are already near the lowest levels of the last 30 years.
The truth may lie somewhere in the middle, then. Overall, rates are still likely to be low and accommodative for the next couple of years when compared to their long-term averages, which should help keep interest in stocks high. At the same time, if we are correct and earnings growth picks up in the quarters ahead, that should bode well for stock prices, so we may still see a large amount of money flowing back from bonds into stocks, particularly among retail investors chasing returns, if stock prices go up while bonds are losing value and still yielding relatively low rates. However, David Kostin does make a fair point that we are certainly not going to see most fixed income investors suddenly switch to stocks – institutional investors are generally limited in what they can invest in by the terms of their portfolio agreements, and bonds will still play a large role for retail investors who need the diversification and income benefits that they can provide. So, on a net basis, I’d say that “the great rotation” may help provide a tailwind for stocks, but it might not be as “great” as many believe. At the end of the day, earnings and economic growth are still the primary drivers behind the stock market and, without this growth, interest rates and stocks may both have trouble rising significantly from current levels.
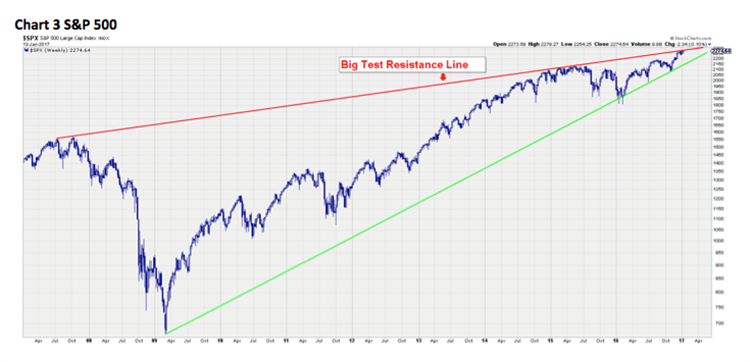
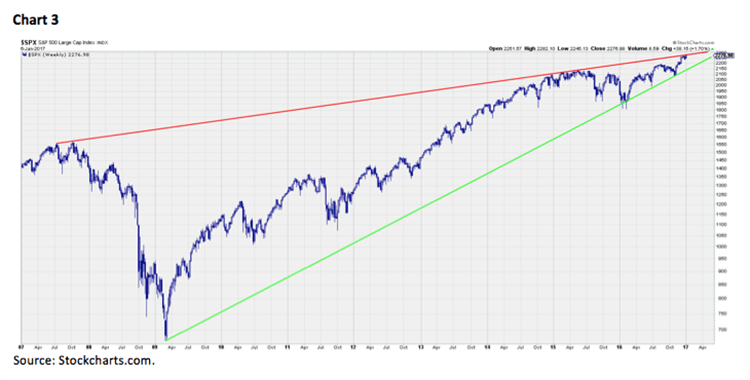
And on a more short-term basis, the S&P 500 seems to be having trouble rising at this very moment, with yet another week behind us where the index basically went nowhere. That’s not an exaggeration, either, as it opened the week trading at 2273 and finished just one point higher at 2274, putting in a total range of only 25 points in the process. Stocks continue to face tough resistance just above current prices, possibly because of that big test line (Chart 3) I have regularly referenced, but there just hasn’t been enough bad news out there to knock prices down. None of the major indices is really breaking down yet, and the NASDAQ has even managed to make new highs in the past few days, but there will likely come a point where the floor gives way if stocks can’t make any more progress on the upside.
As mentioned, our models indicate that late January could be when the market finally runs into trouble, and that could begin as early as this week unless we can break above the overhead selling pressure. It is options expiration week, too, which has historically been difficult in January over the last 18 years, according to Jeff Hirsch, the mind behind the Stock Trader’s Almanac. The S&P 500 has declined in 13 of those 18 years, with an average loss of 1.06%, and this expiration date also happens to come on inauguration day this year, which could up the volatility even more. And that leaves…
The call for this week: Earnings season should be the primary focus with this the first really big week for the 4Q16, though Donald Trump’s cabinet nominees and impending inauguration will continue to get a lot of attention. We will conclude the week with a new president here in the United States, and, as we have mentioned, this could be “buy the rumor, sell the news” type event where traders use the swearing-in as an excuse to take profits. Watch for a possible trading top coinciding with the inauguration, even if that doesn’t exactly make rational sense (when does the market ever make rational sense?). Also, expect even more attention to be paid to corporate earnings releases and conference calls this quarter to see how management teams are planning around the new administration. Investor sentiment seems to have greatly picked up since the election, but it will be interesting to see how companies feel given the uncertainty that exists with all the policy speculation. If managers are mostly in “wait and see” mode when it comes to future investments and strategic action, it could delay the impact Trump’s and Congress’s policies have on corporate earnings. However, we still believe the final earnings numbers will continue to show an improving growth environment, which will hopefully prevent any serious downside for the broad market. So, stay alert, as this has the makings of a pivotal week for the stock market over the short to intermediate term.
Buy C-R-A-P
January 9, 2017
We live in a modern world of acronyms and buzzwords, and the financial industry is certainly no exception. In fact, it may be one of the worst culprits, what with FANG, ZIRP, TINA, BREXIT, QUITALY, BRIC, etc. all entering the lexicon over the last few years. Yet, creating some catchy collection of consonants remains one of the most surefire ways to attract attention in this business since it, admittedly, makes for a great headline and gives strategists like us something fun to write about (“fun” being a relative measure). Well, now the new eye-catching acronym to watch, according to Tom Lee of Fundstrat is C-R-A-P – Computers, Resources, American Banks, and Phone Carriers – which are all levered to the investment recovery, inflation, and deregulation expected over the next year. Before I comment further on those recommendations, though, I want to point out that I like to follow Tom Lee’s thoughts because, like us, he lets the data do most of his thinking, and, like us, he was one of the few pundits last year who actually saw potential for the U.S. stock market. He backed that up, too, with one of the highest S&P 500 targets among strategists for 2016 (2325), but now, according to Bloomberg, he has the lowest price target for 2017 among the fifteen strategists they track (2275), further proof that he doesn’t just parrot consensus numbers.
Reading between the lines of his comments, Lee does not see substantial upside for the stock market as a whole in 2017, at least not without a pullback first, but he does believe potential exists among individual areas of the market. This line of thinking is consistent with our view that passive indexing may be more frustrating in this type of investing environment because you will be dragged down by the underperforming sectors and the increased volatility may make it more difficult to hold onto positions long enough to achieve the eventual performance. We generally agree, too, that the C-R-A-P stocks should do well in the political and economic landscape that many expect is on the horizon. If inflation does pick up, driven by fiscal stimulus and more robust economic growth, Fundstrat argues that the contemporaneous increase in wages will not hit technology company margins as hard given their reliance on more high-skilled workers, and we, too, continue to advise an overweight of Tech to benefit from the Computers sub-sector. The big acronym of 2015 and 2016, the so-called FANG stocks, may already be coming back into favor, as well, with Facebook Inc. (FB/$123.41/Outperform), Amazon.com Inc. (AMZN/$795.99/Outperform), Netflix Inc. (NFLX/$131.07/Outperform), and Alphabet Inc. (GOOG/$806.15/Outperform) all breaking out to new reaction highs last week.
We also continue to like the Energy sector for the Resources play, as our fundamental analyst team in Houston still sees upside for the price of oil over the next couple of years and the companies should be run a bit more efficiently after all the cost-cutting that has been implemented. Their current favorites in the space are Oasis Petroleum Inc. (OAS/$15.58/Strong Buy), Unit Corporation (UNT/$30.25/Strong Buy), Kinder Morgan Inc. (KMI/$21.81/Strong Buy), and Tesoro Logistics L.P. (TLLP/$53.80/Strong Buy).
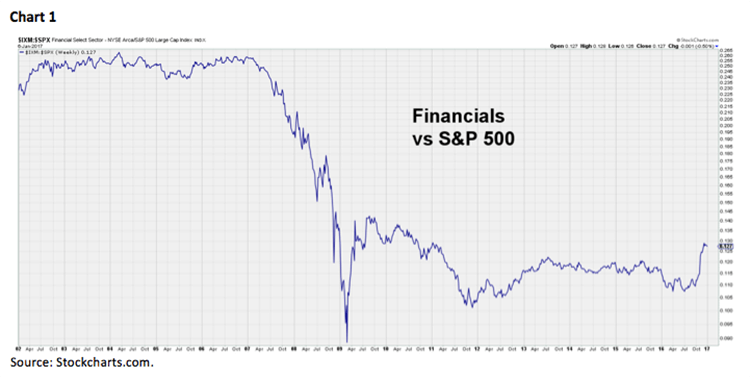
There are no shortage of American banks to choose from, either, but Bank of the Ozarks Inc. (OZRK/$52.36/Strong Buy) and Signature Bank (SBNY/$150.50/Strong Buy) are the two preferred by our analysts at the moment. I have actually received some questions lately asking if the run in banks is coming to an end, and not just in the short-term but for good. We think that’s ludicrous considering Financials have largely underperformed the broad market going all the way back to the early 2000s and it’s going to require more than a two-month run to begin to correct that divergence (Chart 1). In the near term, yes, many of the banks have likely come too far, too fast, but pullbacks should still be for buying, in our opinion as the yield curve is largely expected to steepen further.
Finally, the Phone Carrier part of C-R-A-P is a little trickier, as Donald Trump has already come out in opposition of at least one of the proposed mergers to further consolidate the industry and put more control in the hands of the major players. However, if we do experience a run of broad deregulation across the general business landscape, the big phone carriers could see some benefits in the form of pricing power (per Forbes), in addition to improving demand as the overall economy gets better. Verizon Communications Inc. (VZ/$53.26/Outperform), AT&T Inc. (T/$41.32/Outperform), and T-Mobile US Inc. (TMUS/$56.77/Outperform) are all rated “buys” by our fundamental analysts.
Fundstrat concluded their C-R-A-P report by throwing in some caveats, including the risk that “sloppy White House organization creates confusion on U.S. policy, particularly as tweets become policy.” They estimate the new administration could bring with it at least a 5% dip in the first half of the year, something that should come as little surprise given the great run we have enjoyed and should not be a significant concern. Coming into 2017, the biggest risk, in our opinion, was that no one seemed to be talking about any risks, and I think it’s pretty telling that Tom Lee is the most pessimistic strategist in the Bloomberg survey and even his year-end target is almost exactly where we are now – so not exactly bearish.
However, risks do exist (and these are just the obvious ones):
- Perfection from Trump and the Republicans is largely priced in over the near term;
- There is bound to be a disappointment at some point – either not enough stimulus or deregulation vis-à-vis market expectations or it doesn’t come quickly enough;
- A few reports I have seen indicate that some businesses may be delaying further investments or other strategic actions until the new administration’s policies become clearer; if they are forced to wait indefinitely it could start to hurt the overall economy;
- The same goes for many investors, who likely held off on selling positions last year with the expectation that lower taxes would be coming. The question now becomes do we see a round of delayed selling as soon as we get a better idea about the tax implications;
- Considering investors everywhere are refreshing Twitter every few minutes to see what Donald Trump will say next, the market is always one tweet away from being scared off certain companies or industries.
So, it is not unreasonable to think we may start to see some weakness in the coming sessions as inauguration day approaches. As Jeff Saut wrote in our Morning Tack from last Thursday:
Our models continue to telegraph a move higher into late month, although approaching mid-month, we are trimming some of our enthusiasm. That view rests on the fact that we have played the rally pretty aggressively. However, from a tactical standpoint, we are taking a more cautious stance as mid-January approaches consistent with our model’s cautionary call for late January.
I have heard from a lot of smart people that the days around the inauguration could end up representing a short-term trading top, as profits from the election rally are locked in and we start to get a real idea of how President Trump will differ from Candidate or President-elect Trump. And if enough traders start to believe an impending top is coming, they may accelerate their selling. To be clear, we don’t anticipate any major correction to occur and we still believe stocks will largely go up in 2017, but a pullback in the 5-10% range would not be the worst thing in the short term and would likely give you a good chance to buy those stocks previously mentioned.
The call for this week: As SentimenTrader pointed out on Friday:
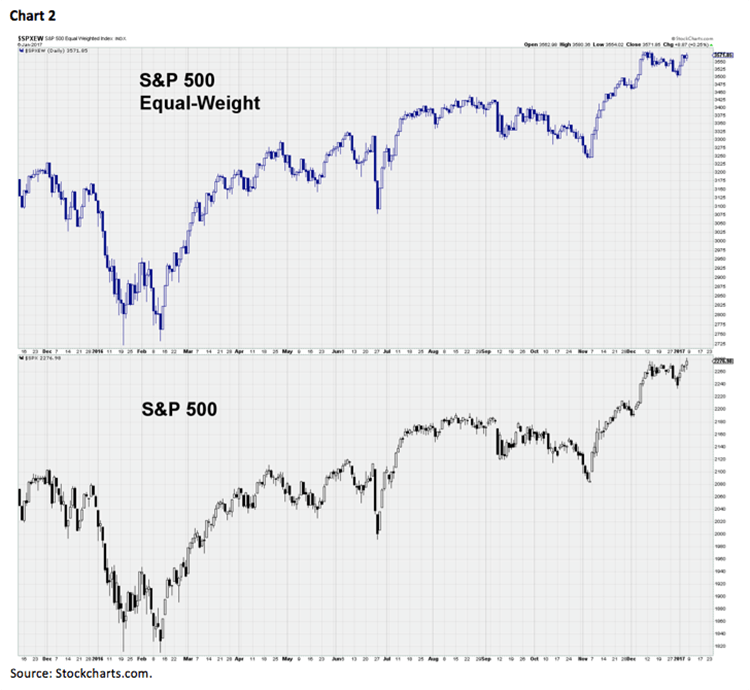
Despite a new all-time high in the S&P 500, there were more declining securities than advancing ones on the NYSE. The amount of volume flowing into those securities was the 5th-worst ever on a day the S&P hit an all-time high. And the percentage of issues reaching a 52-week high wasn’t far behind, also lagging badly. The last time breadth was this bad at an all-time high in the S&P was the bull market peak on March 24, 2000.
Moreover, the equal-weight S&P 500 did not join its more common, cap-weighted cousin by making a new all-time high (Chart 2), and small cap stocks, which led for most of this recent rally, have finally started to slacken. So, market breadth does seem to be slumping a bit, which is often a preamble to weakness in the major averages, and we could start to see traders position themselves for short-term trading top coinciding with the inauguration. Therefore, if you are looking to take profits and reduce equity exposure, this coming week may be a good opportunity to do so. The anticipated weakness in the coming sessions should not significantly impact more long-term investors, and may finally give those who missed out on the election rally a chance to buy in, but it is cause to remain vigilant. The “big test” for the S&P 500 I have mentioned recently remains its place as resistance (Chart 3), and, unless we can rise above that level (roughly 2280-2285), there may be limited upside in the near term.
Market mantras
January 3, 2016
“It’s what you learn after you know it all that counts.”
. . . Earl Weaver
Now is the time of year when strategists, economists, gurus, etc. all join in on the annual nonsense of predicting “What’s going to happen in the markets for 2017?” For many, this ritual is an ego trip, yet as Benjamin Graham inferred, forecasting where the markets will be a year from now is nothing more than rank speculation. Or, as we have noted, “You might as well flip a lucky penny.” Manifestly, while forecasting is fun, it should in no way be construed to be investment advice. That is why we try hard to avoid the annual guessing game and attempt to focus on what the markets are “saying,” what sectors look favorable, and what stocks we want to own in the new year. This year we have made an exception to that strategy, because our new friends at Alex Brown want a price target for the S&P 500 (SPX/2238.83) in 2017. In past missives, we have explained why our price target for 2017 is 2450. However, typically when “pressed” for a prediction, we tend to look at where the SPX is currently trading and state, “The average yearly return for the S&P 500 since 1926 has been ~10.4%, so we think it will be up 10.4% in the new year. Surprisingly, a 10.4% gain in 2017, from where the SPX currently resides, is very close to 2450 (2238 + 232=2470).
That said, lost in the “noise” of the annual soothsaying contest are some simple tenets of investing, with one of the best examples published in The Financial Analysts Journal in 1995. It was penned by Arthur Ziekel (at the time head of Merrill Lynch Asset Management) as a letter to his daughter on investing. To wit:
“Personal portfolio management is not a competitive sport. It is, instead, an important individualized effort to achieve some predetermined financial goal balancing one’s risk-tolerance level with the desire to enhance capital wealth. Good investment management practices are complex and time consuming, requiring discipline, patience, and consistency of application. Too many investors fail to follow some simple, time-tested tenets that improve the odds of achieving success and, at the same time, reduce the anxiety naturally associated with an uncertain undertaking.
I hope the following advice will help:
A fool and his money are soon parted.
Investment capital becomes a perishable commodity if not handled properly.
Be serious. Pay attention to your financial affairs. Take an active, intensive interest. If you don’t, why should anyone else?
There is no free lunch.
Risk and return are interrelated. Set reasonable objectives using history as a guide. All returns relate to inflation. Better to be safe than sorry. Never up, never in.
Most investors underestimate the stress of a high-risk portfolio on the way down.
Don’t put all your eggs in one basket.
Diversify. Asset allocation determines the rate of return. Stocks beat bonds over time.
Never overreach for yield.
Remember, leverage works both ways. More money has been lost searching for yield than at the point of a gun (Ray DeVoe).
Spend interest, never principal.
If at all possible, take out less than comes in. Then, a portfolio grows in value and lasts forever. The other way around, it can be diminished quite rapidly.
You cannot eat relative performance.
Measure results on a total return, portfolio basis against your own objectives, not someone else’s.
Don’t be afraid to take a loss.
Mistakes are part of the game. The cost price of a security is a matter of historical significance, of interest only to the IRS.
Averaging down, which is different from dollar cost averaging, means the first decision was a mistake. It is a technique used to avoid admitting a mistake or to recover a loss against the odds. When in doubt, get out. The first loss is not the best but is also usually the smallest.
Watch out for fads.
Hula hoops and bowling alleys (among others) didn’t last. There are no permanent shortages (or oversupply). Every trend creates its own countervailing force. Expect the unexpected.
Act.
Make decisions. No amount of information can remove all uncertainty. Have confidence in your moves. Better to be approximately right than precisely wrong.
Take the long view.
Don’t panic under short-term transitory developments. Stick to your plan. Prevent emotion from overtaking reason. Market timing generally doesn’t work. Recognize the rhythm of events.
Remember the value of common sense.
No system works all of the time. History is a guide, not a template.
This is all you really need to know.
Love, Dad”
The call for this week: Unless the equity markets rally sharply today and tomorrow, we did not get a Santa Claus rally (SCR). Recall, the SCR is the seasonal tendency for equities to rally during the last five sessions of the year through the first two trading sessions of the new year. Many pundits take the lack of a SCR as an ominous warning for stocks; we do not. Admittedly, we did not get an SCR in 2015, and we got a “trapdoor” decline into the SPX’s February 11, 2016 “low” of ~1810. That decline also rendered a negative reading from the January Indicator (so goes the first week of the new year, so goes the month and so goes the year); and, the first week, of 2016 was down as was the month of January. As well, the January Barometer (if the December closing low is violated any time in the first quarter of the new year, watch out) registered a negative signal when the December 2015 closing low was “taken out” on January 4, 2016. Despite that cacophony of negative signals, our models flipped positive on February 5, 2016 “calling” for a market bottom the next week. From that week’s low (1810) the SPX gained ~23.7% into last Friday’s closing bell . . . not bad! So, our intermediate-term model called the recent rally, from before the election, no matter who won. We have to admit that the Trump win accelerated the envisioned rally. Subsequently, our short-term model called for a trading top the week of 12-11-16 and was “looking” for a bottom into late last week with a +/-5 session variance. Since mid-December, the SPX has pulled back about 1.5%, and that “stall” has permitted the stock market’s “internal energy” to rebuild to almost a full charge. This suggests our intermediate-term model’s “call,” prior to the election for the equity markets to trade higher into late January/early February, is still enforce. If that pattern proves correct, the models then look for some kind of downside attempts beginning in late January, which do not get very far. Our long-term model has not varied since March of 2009 in that we are in a secular bull market that has years left to run. And that’s the way it is on session 36 of the “buying stampede.”
Additional information is available on request. This document may not be reprinted without permission.
Raymond James & Associates may make a market in stocks mentioned in this report and may have managed/co-managed a public/follow-on offering of these shares or otherwise provided investment banking services to companies mentioned in this report in the past three years.
RJ&A or its officers, employees, or affiliates may 1) currently own shares, options, rights or warrants and/or 2) execute transactions in the securities mentioned in this report that may or may not be consistent with this report’s conclusions.
The opinions offered by Mr. Saut should be considered a part of your overall decision-making process. For more information about this report – to discuss how this outlook may affect your personal situation and/or to learn how this insight may be incorporated into your investment strategy – please contact your Raymond James Financial Advisor.
All expressions of opinion reflect the judgment of the Equity Research Department of Raymond James & Associates at this time and are subject to change. Information has been obtained from sources considered reliable, but we do not guarantee that the material presented is accurate or that it provides a complete description of the securities, markets or developments mentioned. Other Raymond James departments may have information that is not available to the Equity Research Department about companies mentioned. We may, from time to time, have a position in the securities mentioned and may execute transactions that may not be consistent with this presentation’s conclusions. We may perform investment banking or other services for, or solicit investment banking business from, any company mentioned. Investments mentioned are subject to availability and market conditions. All yields represent past performance and may not be indicative of future results. Raymond James & Associates, Raymond James Financial Services and Raymond James Ltd. are wholly-owned subsidiaries of Raymond James Financial.
International securities involve additional risks such as currency fluctuations, differing financial accounting standards, and possible political and economic instability. These risks are greater in emerging markets.
Investors should consider the investment objectives, risks, and charges and expenses of mutual funds carefully before investing. The prospectus contains this and other information about mutual funds. The prospectus is available from your financial advisor and should be read carefully before investing.